 Port
PortGlossary of Investment Terms
Short, honest definitions with numerical examples. No unverifiable jargon, and no sentences that sound smart but mean nothing.
Company Earnings
EPS
A company's net profit attributable to one share.
Analyst Consensus
The average forecast for a company's earnings, prepared by analysts covering it.
Earnings Surprise
The percentage difference between a company's actual earnings and analysts' estimates.
Quarterly Report
A public company's financial statement for three months of operations.
Earnings Season
The period of several weeks after a quarter ends, when most companies publish their reports.
ESPI
The system through which WSE-listed companies publish information that may affect their share price.
Guidance
Management's own expectations for future earnings, provided with the report.
Metrics
C/Z
Share price divided by earnings per share.
Market Capitalization
The total market value of a company: share price multiplied by the total number of shares outstanding.
Dividend
A portion of a company's profit paid out to shareholders.
Net margin
The portion of revenue that remains with the company as net profit.
EBITDA
Operating profit plus depreciation and amortization—an approximation of the cash generated by the business.
ROE
How much profit a company generates for every dollar of shareholder equity.
Net Debt
A company's debt minus its cash holdings.
Target Price
The share price level an analyst estimates for a stock, usually within a one-year horizon.
Portfolio & Performance
XIRR
The annualized rate of return of a portfolio, accounting for the dates and amounts of all contributions and withdrawals.
TWR
A measure of investment performance itself, unaffected by contributions and withdrawals.
Rate of Return
The percentage change in the value of an investment over a given period.
Benchmark
A benchmark against which you compare your portfolio's performance.
Diversification
Spreading capital so that the outcome does not depend on a single event.
Correlation
A measure of whether two instruments move in the same direction.
Portfolio concentration
The share of the largest positions in the entire portfolio.
Volatility
A measure of how much an instrument's value fluctuates over time.
Beta
A measure of an instrument's sensitivity to overall market movements.
Drawdown
The largest drop in portfolio value from peak to trough.
Instruments and Market
ETF
A fund traded like a stock that tracks the performance of an index, sector, or commodity.
TER
The annual cost of managing a fund, expressed as a percentage of the investment's value.
Stock market index
An indicator showing the change in value of a basket of companies representing the market or a part of it.
WIG20, mWIG40, sWIG80
The main indices of the Warsaw Stock Exchange, categorizing companies by size.
GPW
The main market for stock trading in Poland, operating since 1991.
Blue chip
A large, liquid company with an established position, usually part of the main index.
Liquidity
The ease of buying or selling an instrument without affecting its price.
Spread
The difference between the best bid and best ask price.
Trading volume
The number of shares that changed hands during a given period.
Short Selling
A transaction that profits from a falling share price, based on selling borrowed shares.
Costs and Taxes
Macroeconomics
Inflation
An increase in the general price level, which reduces the purchasing power of money.
CPI
A measure of inflation based on a basket of goods and services purchased by households.
Interest rate
The price of money in the economy, set by the central bank.
MPC, ECB, Fed
Interest rate-setting bodies in Poland, the Eurozone, and the United States.
From Definition to Practice
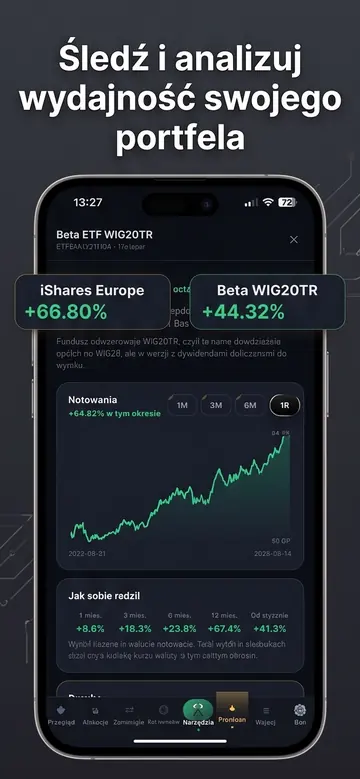
You can see all these indicators for specific companies in Portevo, compared to the industry median, to provide context for the numbers.
Portevo is not an investment advisor. The data and analyses are for informational and educational purposes only and do not constitute a recommendation or an offer to buy or sell financial instruments. Quotes are from external providers and may be delayed. You make investment decisions at your own risk.
Your entire portfolio, company earnings, and insider trades in one place
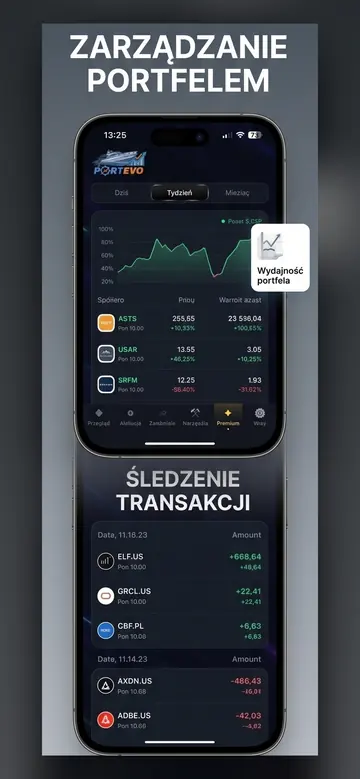
Upload your XTB report or add companies manually — Portevo will calculate your net profit after costs, show you the earnings dates for your companies, and display insider faces on charts.
- Portfolio with Net Profit After Costs
- Earnings Calendar for Your Companies
- Pelosi, Trump, and CEO Trades on a Chart
- Works in Browser and on iPhone
No credit card required. A demo portfolio is available immediately; create your own by uploading a report.