 Port
PortP/E Ratio Explained
Share price divided by earnings per share.
Explanation
P/E ratio. It indicates how many years of current earnings are reflected in the share price, or, in other words, how many zlotys you pay for one zloty of a company's annual earnings.
A high P/E ratio doesn't automatically mean a company is expensive. It means the market expects earnings growth. A low P/E doesn't mean a bargain — sometimes the market anticipates a decline. The ratio itself is useless without context: compare it with other companies in the same industry and with the company's own history.
You will encounter two versions: current (based on earnings from the last twelve months) and forecast (based on expected earnings). The latter can differ significantly, especially for fast-growing companies.
Example
The share price is PLN 100, EPS is PLN 5. The P/E ratio is 20. With an industry median of 12, the company is valued at a significant premium—the question is whether it's justified.
Related Terms
See P/E Live
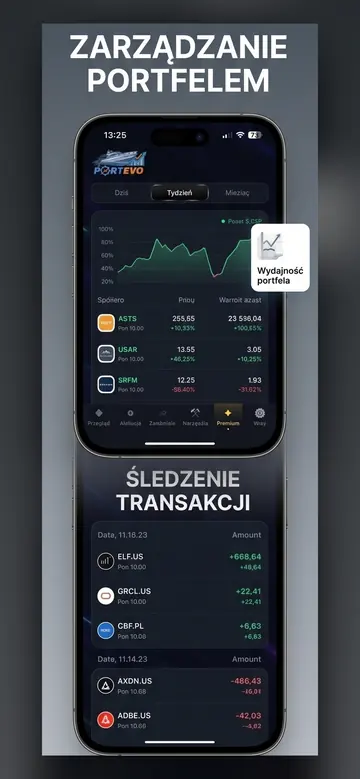
Portevo displays this and dozens of other metrics for specific companies, along with an earnings calendar and your portfolio.
Portevo is not an investment advisor. The data and analyses are for informational and educational purposes only and do not constitute a recommendation or an offer to buy or sell financial instruments. Quotes are from external providers and may be delayed. You make investment decisions at your own risk.
Your entire portfolio, company earnings, and insider trades in one place
Upload your XTB report or add companies manually — Portevo will calculate your net profit after costs, show you the earnings dates for your companies, and display insider faces on charts.
- Portfolio with Net Profit After Costs
- Earnings Calendar for Your Companies
- Pelosi, Trump, and CEO Trades on a Chart
- Works in Browser and on iPhone
No credit card required. A demo portfolio is available immediately; create your own by uploading a report.