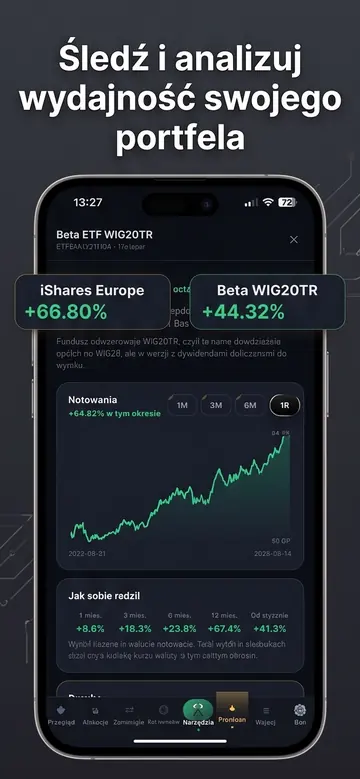
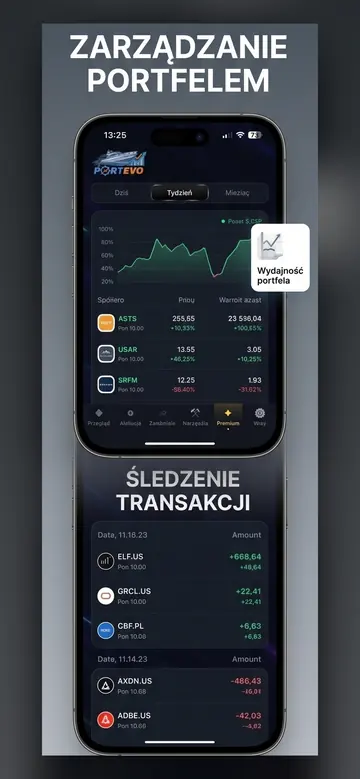
 Port
PortPortfolio Analysis — Allocation, Diversification, and Risk
A portfolio of twenty companies can be less diversified than one of five — if they are all in the same industry and currency. Our analysis shows you the full picture, leaving nothing to guesswork.
Six Ways to View the Same Portfolio
The same set of positions, shown in six breakdowns: asset class, market, sector, currency, individual position, and brokerage account. Cash is included with the rest, because money held in an account is also an allocation decision—just rarely a conscious one.
Risk Analysis
- Concentration — the percentage of your portfolio held in your largest position and in your top five positions.
- Volatility — how much your portfolio fluctuates compared to the broader market.
- Contribution to volatility — which company actually drives the overall movement. It's rarely the one you suspect.
- Correlation Matrix — do your largest positions move together? Three tech companies are, in practice, one position multiplied by three.
What is this for?
Not to predict the market—no one can do that. But to notice the risks you've already taken without making a conscious decision about them: concentration in one industry, an entire portfolio in one currency, or a position that has grown so large it dictates the overall outcome.
Frequently Asked Questions
What is portfolio diversification?
Spreading capital so that your returns don't depend on a single event. It's not about the number of positions, but whether they react to different things — ten companies from the same industry usually fall together.
What is correlation and why check it?
It's a measure of whether two instruments move in the same direction. High correlation between positions means the portfolio is less diversified than the number of companies suggests.
Is risk analysis a paid feature?
Basic portfolio allocation by asset class, sector, and currency is free. Risk X-ray and correlation matrix are part of the paid version ($4.99 per month).
Related topics
Find out where your risk truly lies
Upload your brokerage statement, and your portfolio allocation and position concentration will be calculated automatically.
Portevo is not an investment advisor. The data and analyses are for informational and educational purposes only and do not constitute a recommendation or an offer to buy or sell financial instruments. Quotes are from external providers and may be delayed. You make investment decisions at your own risk.
Your entire portfolio, company earnings, and insider trades in one place
Upload your XTB report or add companies manually — Portevo will calculate your net profit after costs, show you the earnings dates for your companies, and display insider faces on charts.
- Portfolio with Net Profit After Costs
- Earnings Calendar for Your Companies
- Pelosi, Trump, and CEO Trades on a Chart
- Works in Browser and on iPhone
No credit card required. A demo portfolio is available immediately; create your own by uploading a report.