 Port
PortVolatility — What Is It?
A measure of how much an instrument's value fluctuates over time.
Explanation
Calculated as the standard deviation of returns, usually annualized. High volatility means large fluctuations in both directions — it doesn't only mean declines.
Volatility is the most commonly used approximation of risk, but it only measures price fluctuations. It says nothing about the risk that a company might simply cease to exist, or whether the price is reasonable.
Example
A stock with an annual volatility of 40% fluctuates roughly twice as much as a broad stock index, which typically has a volatility of 15–20%.
Related Terms
See Live Volatility
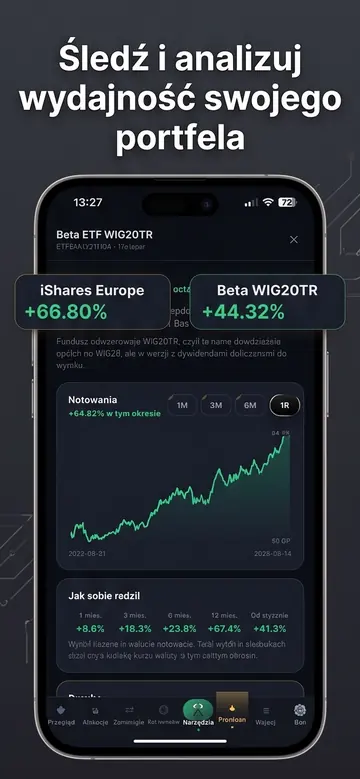
Portevo displays this and dozens of other metrics for specific companies, along with an earnings calendar and your portfolio.
Portevo is not an investment advisor. The data and analyses are for informational and educational purposes only and do not constitute a recommendation or an offer to buy or sell financial instruments. Quotes are from external providers and may be delayed. You make investment decisions at your own risk.
Your entire portfolio, company earnings, and insider trades in one place
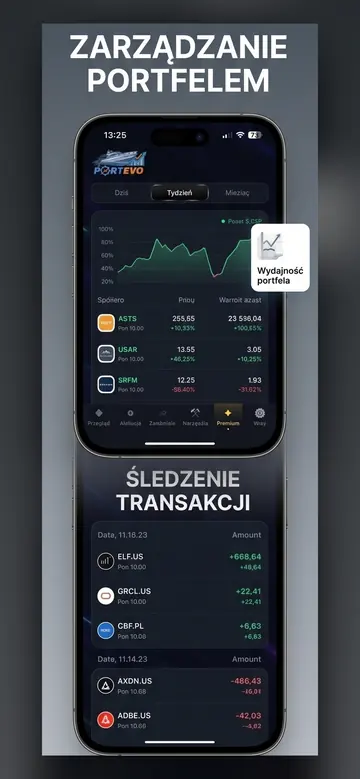
Upload your XTB report or add companies manually — Portevo will calculate your net profit after costs, show you the earnings dates for your companies, and display insider faces on charts.
- Portfolio with Net Profit After Costs
- Earnings Calendar for Your Companies
- Pelosi, Trump, and CEO Trades on a Chart
- Works in Browser and on iPhone
No credit card required. A demo portfolio is available immediately; create your own by uploading a report.