 Port
PortWhat Is Correlation?
A measure of whether two instruments move in the same direction.
Explanation
It ranges from −1 to +1. A value close to +1 means the instruments tend to rise and fall together; close to 0 means their movements are independent; and a negative value means they move in opposite directions.
High correlation between positions means the portfolio is less diversified than the number of companies might suggest. It's worth remembering that correlations tend to increase during market panics—precisely when diversification would be most needed.
Example
Two mining companies have a correlation of 0.85. Holding both offers little more diversification than holding one at double the size.
Related Terms
See Live Correlation
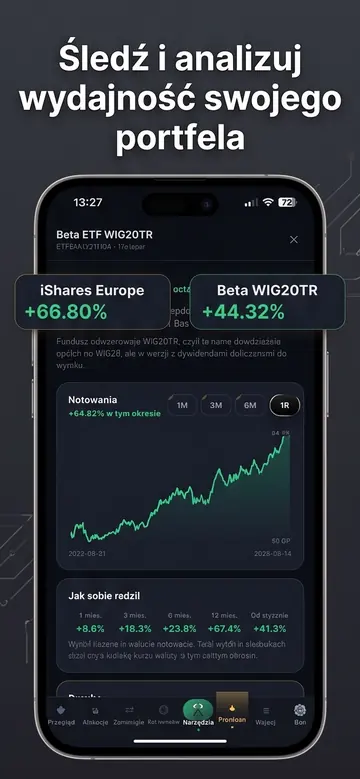
Portevo displays this and dozens of other metrics for specific companies, along with an earnings calendar and your portfolio.
Portevo is not an investment advisor. The data and analyses are for informational and educational purposes only and do not constitute a recommendation or an offer to buy or sell financial instruments. Quotes are from external providers and may be delayed. You make investment decisions at your own risk.
Your entire portfolio, company earnings, and insider trades in one place
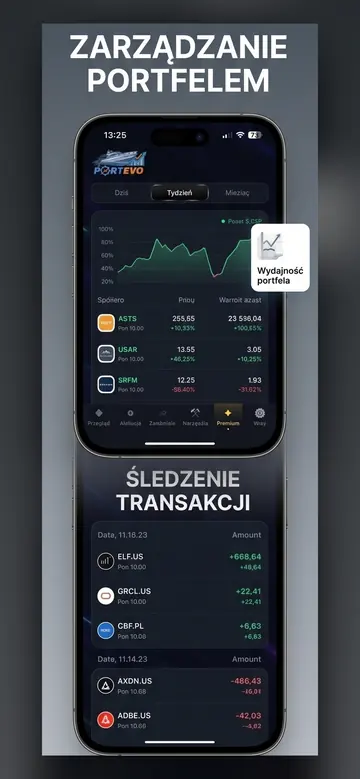
Upload your XTB report or add companies manually — Portevo will calculate your net profit after costs, show you the earnings dates for your companies, and display insider faces on charts.
- Portfolio with Net Profit After Costs
- Earnings Calendar for Your Companies
- Pelosi, Trump, and CEO Trades on a Chart
- Works in Browser and on iPhone
No credit card required. A demo portfolio is available immediately; create your own by uploading a report.