 Port
Port
DocuSign (DOCU) Earnings
DocuSign earnings release dates, analyst consensus, and how the stock reacted to past earnings reports—all in one place, in English.
When DocuSign Reports Earnings
The next DocuSign report is scheduled for December 3, 2026. The date has not yet been confirmed by the company and may change.
The expected earnings per share (EPS) is 1.18 USD. Analyst forecasts range from 1.14 to 1.23 USD. The market reacts not to the absolute earnings, but to the difference between the actual result and this forecast.
Expected revenue: $888.83M.
DocuSign's Last Report: What the Numbers Showed
DocuSign's last published report covers the quarter ended July 31, 2026. Revenue was $875.75 million, and net income was $77.72 million. Earnings per share reached $1.16 compared to analysts' forecast of $1.09—beating expectations by 6.85%. On the first trading day after the release, the share price changed by +4.62%.
Insider Transactions: DocuSign
Who from the management board, supervisory board, US Congress, or government bought and sold shares of this company — based on official filings.

How the stock reacted to past earnings
The company beat analyst estimates in 100% of the last 4 quarters.
The average share price change on the day after earnings release is 6.47% — regardless of direction. The largest move was 9.81%. This number says more about the risk of holding a position through an earnings report than the earnings forecast itself.
| Quarter | Release date | EPS estimate | Actual EPS | Surprise | Share price reaction |
|---|---|---|---|---|---|
| July 31, 2026 | September 3, 2026 | 1.09 | 1.16 | +6.85% | +4.62% |
| April 30, 2026 | June 4, 2026 | 0.99 | 1.09 | +9.74% | -9.81% |
| January 31, 2026 | March 17, 2026 | 0.95 | 1.01 | +6.36% | +4.44% |
| October 31, 2025 | December 4, 2025 | 0.92 | 1.01 | +10.30% | -7.01% |
How much this company's stock moves after earnings
DocuSign's share price changes by an average of 6.47% on the first trading day after earnings are released — based on the last 4 reports, regardless of direction. This ranks 74 out of 180 companies for which we calculated this statistic.


Analyst forecasts for upcoming periods
The consensus is the average of many analysts' forecasts. The more analysts behind a number, the less likely it is to be a single error—but forecast agreement is never a guarantee of the actual result.
| Period | EPS estimate | EPS a year ago | Change | Revenue forecast | Analysts |
|---|---|---|---|---|---|
| Current quarter | 1.18 | 1.01 | +16.72% | $888.83 million | 17 |
| Next quarter | 1.19 | 1.01 | +17.63% | $909.98 million | 17 |
| Current year | 4.62 | 3.84 | +20.34% | $3.50 bn | 19 |
| Next year | 5.21 | 4.62 | +12.75% | $3.78 bn | 20 |
Revenue and margins quarter by quarter
Margin shows how much of sales a company retains. Rising revenue with shrinking margins means growth is coming at the expense of profitability—and that's usually more interesting than sales growth alone.
| Quarter | Revenue | Gross margin | Operating margin | Net margin |
|---|---|---|---|---|
| July 31, 2026 | $875.75 million | 79.69% | 13.43% | 8.87% |
| April 30, 2026 | $830.24 million | 79.37% | 13.41% | 9.42% |
| January 31, 2026 | $836.86 million | 79.71% | 10.48% | 10.79% |
| October 31, 2025 | $818.35 million | 79.16% | 10.43% | 10.23% |
| July 31, 2025 | $800.64 million | 79.33% | 8.15% | 7.86% |
Who Reports in the Coming Weeks
Dates from the Portevo calendar — companies in the same industry are listed first, as their earnings often move the share prices of their peers even before their own reports.


About DocuSign
DocuSign, Inc. is listed on Nasdaq under the ticker DOCU, and its headquarters are in the United States. The company belongs to the technology sector (industry: Software - Application).
- Ticker: DOCU
- Exchange: Nasdaq
- Trading Currency: USD
- Sector: Technology
- Number of Analysts Providing Estimates: 16
- 52-Week Range: 40.16 – 75.00
- Company website: https://www.docusign.com
Frequently Asked Questions
When does DocuSign release earnings?
The next report is due on December 3, 2026. This date is an estimate and may be subject to change by the company.
What were DocuSign's results last quarter?
For the quarter ended July 31, 2026: revenue $875.75 million, net income $77.72 million, EPS $1.16. This is +6.85% compared to analyst forecasts.
What is DocuSign's stock ticker?
DOCU — on the Nasdaq exchange. You may also see DOCU on quote services.
What is the EPS forecast for DocuSign?
The analyst consensus for the upcoming quarter is $1.18 per share. Individual forecasts range from $1.14 to $1.23.
How much does DocuSign's share price typically change after earnings?
On average, 6.47% in the session after publication, counting both directions. The largest recorded movement was 9.81%.
Does DocuSign usually beat analyst forecasts?
In the last 4 quarters, results exceeded forecasts in 100% of cases. History does not predict the next report, but it shows how cautiously analysts approach this company.
Where to find DocuSign earnings in English?
On Portevo — the earnings calendar, analyst forecasts, surprise history, and share price reactions are available for free and without an account.
Other Companies in the Technology Sector
A company's earnings are most informative when compared to competitors in the same industry — this shows whether a weak quarter was a company-specific issue or a market-wide trend.


Related
Track DocuSign on Portevo
The company page in the app includes a price chart, indicators, and industry comparisons. Add a company to your watchlist, and its report will be highlighted in the earnings calendar—along with the rest of your portfolio.
Portevo is not an investment advisor. The data and analyses are for informational and educational purposes only and do not constitute a recommendation or an offer to buy or sell financial instruments. Quotes are from external providers and may be delayed. You make investment decisions at your own risk.
Your entire portfolio, company earnings, and insider trades in one place
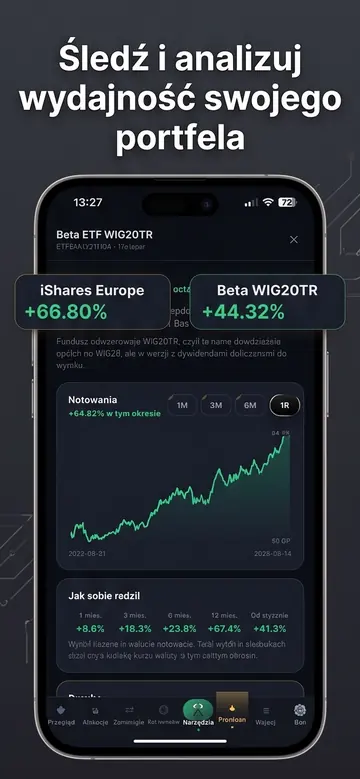
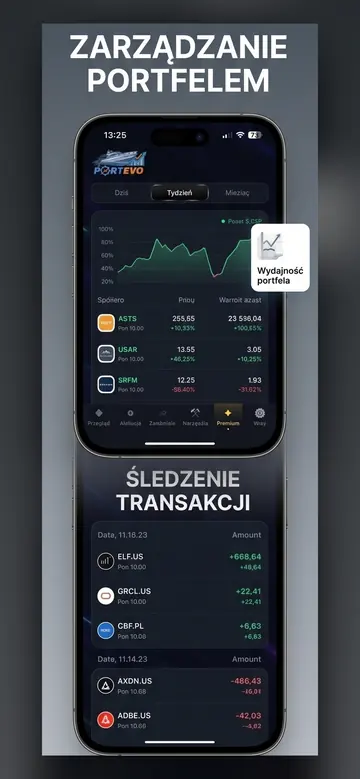
Upload your XTB report or add companies manually — Portevo will calculate your net profit after costs, show you the earnings dates for your companies, and display insider faces on charts.
- Portfolio with Net Profit After Costs
- Earnings Calendar for Your Companies
- Pelosi, Trump, and CEO Trades on a Chart
- Works in Browser and on iPhone
No credit card required. A demo portfolio is available immediately; create your own by uploading a report.